Microplastics in Tap and Bottled Water: What Is Actually Known
Plastic particles have been found in tap water, bottled water and bottled water's own packaging. This sets out what the World Health Organization concluded, why the counts reported in the news vary so wildly, and why pore size is the right question to ask about plastic but not about most other contaminants.
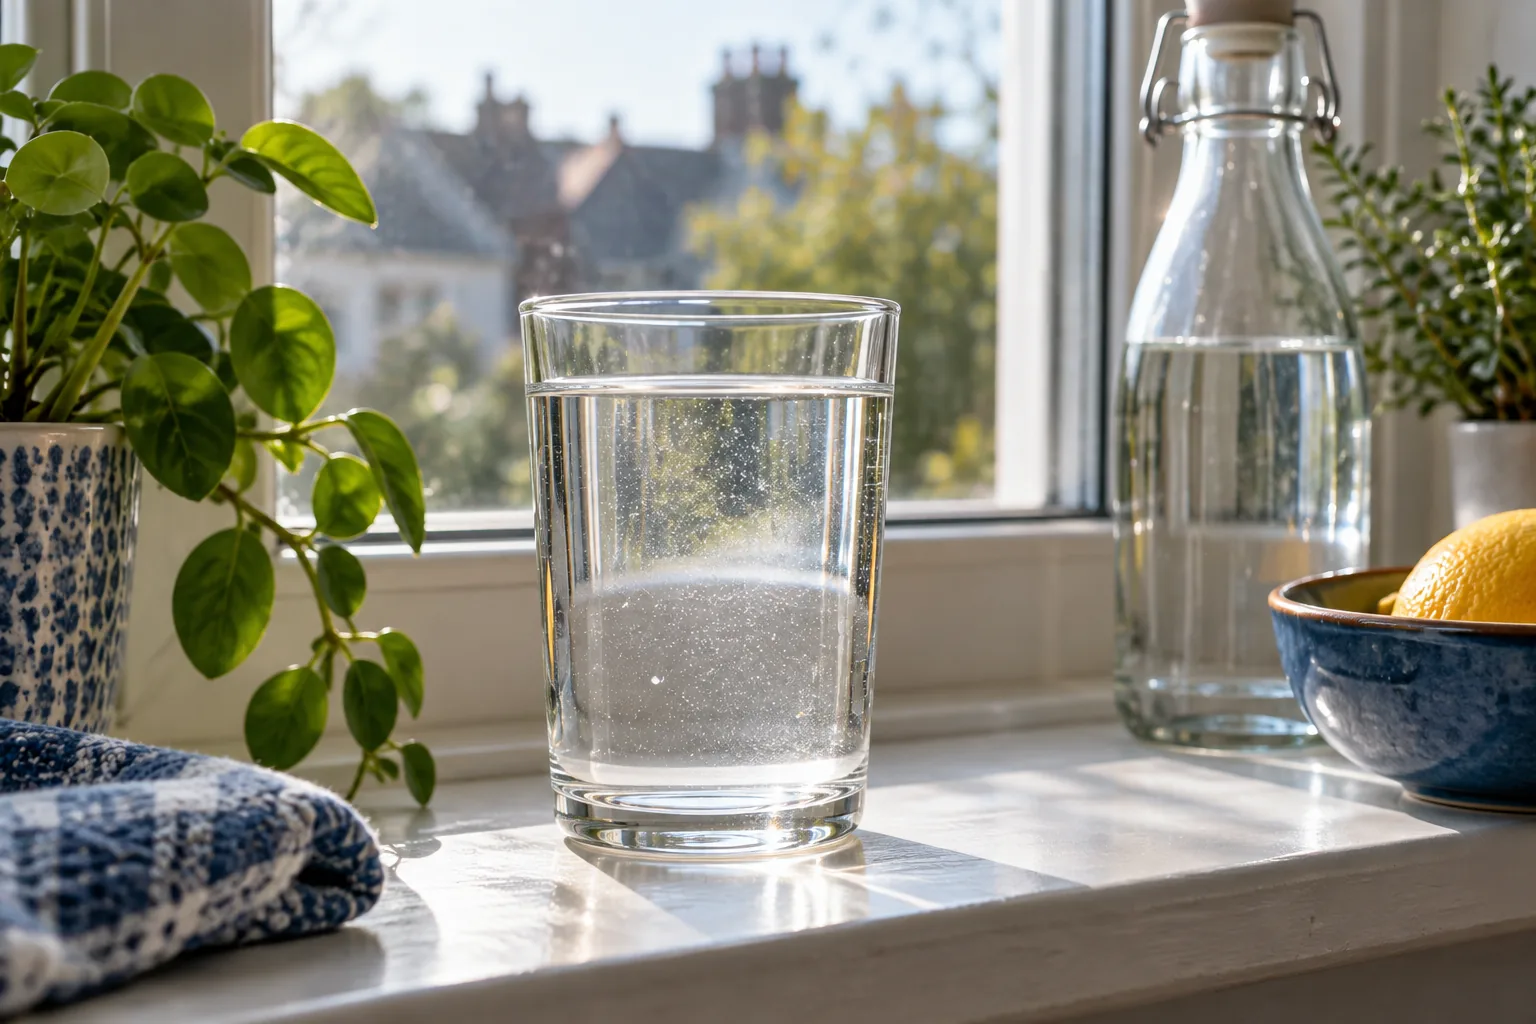
Plastic particles are present in drinking water, and the World Health Organization's assessment is that the health risk at current levels appears low while the evidence remains limited. The measurement itself is the weak link: different studies count different size ranges, which is why headline numbers disagree by orders of magnitude.
✓ 5-Second Summary & Core Facts
- Plastic fragments have been found in both tap and bottled water.
- The World Health Organization judged the risk low but the evidence limited.
- Studies count different size ranges, so their numbers are not comparable.
- Plastic is a particle, so pore size genuinely applies to it.
- Smaller fragments are the hardest both to measure and to filter.
Plastic fragments turn up in drinking water. That much is settled, and it has been reported in tap water and bottled water alike. What is far less settled is how many, how small, and whether it matters to your health — and the gap between those two levels of certainty is where most of the confusion lives.
This is an attempt to separate what is established from what is still being argued about.
What the World Health Organization concluded
In 2019 the World Health Organization published a review of microplastics in drinking water, pulling together the studies available at that point. Its assessment was cautious in both directions.
On risk, the conclusion was that microplastics in drinking water do not appear to present a health concern at the levels then being measured. On the evidence, the conclusion was that the available research was limited in quality and coverage, and that this was itself a reason not to be confident.
Those two findings belong together. "The risk looks low" and "we do not have much to go on" are both true statements about the same body of work, and quoting either one alone misrepresents it. The report's own recommendation was for better research rather than for immediate action by water suppliers or households.
Why the reported numbers disagree so violently
You will see particle counts for bottled water that differ between studies by a factor of thousands. It is tempting to assume someone is wrong. Usually nobody is — they are counting different things.
The critical variable is the smallest size a study could actually detect. A method that can see down to ten microns will report one number. A method that can see down to a fraction of a micron looks at the same bottle of water and finds vastly more fragments, because the smaller the size range you can measure, the more particles there are in it. Small fragments outnumber large ones enormously.
So a newer study reporting a much higher count is not necessarily contradicting an older one. It is often reporting on a size range that was previously invisible. This is why the phrase "microplastics" in a headline is close to meaningless without the size range attached, and why comparing two figures from different studies is usually comparing two different questions.
A particle count with no size range attached is not a measurement. It is a number.
The practical consequence for you: a filter advertised as reducing microplastics is making a claim about some size range. If the range is not stated, the claim does not have a definite meaning.
Where the plastic comes from
Two routes, and they are worth distinguishing because they have different implications.
- The water source. Plastic waste breaks down in the environment into progressively smaller fragments, which reach rivers, lakes and groundwater. Treatment plants remove a great many of them, but they are not designed around this contaminant specifically.
- The packaging. Bottled water is in contact with plastic. Bottles shed particles, particularly under mechanical stress, heat or repeated opening. This is why bottled water often measures higher than tap water from the same region — the container is a source in its own right.
Neither of these is a scandal so much as a consequence of a material that is everywhere and does not break down cleanly.
Why pore size is the right question here
Most of the contaminants people worry about in drinking water are dissolved, which means no sieve can catch them. Plastic fragments are one of the exceptions. They are genuine solid particles suspended in the water, so they can, in principle, be strained out.
That makes the physical rating of a filter directly relevant, which is unusual. It also means the nominal-versus-absolute distinction matters: an average pore size lets wider particles through some of the wider gaps. We set out how those ratings work, and the difference between straining and adsorption, in our guide to the micron scale and what pore size decides.
The catch is the size range again. A filter can be genuinely effective against fragments above a micron and do very little about fragments well below one, and "microplastics" as a word covers both.
Why a jug filter is not the tool for this
Loose granulated carbon, which is what most jug filters contain, leaves comparatively wide channels between the grains. Water under nothing but gravity takes the easiest route through. That is adequate for chlorine taste and is why jugs are popular and genuinely useful for what they do.
It is not a fine physical barrier. We looked at what that means when jugs are tested against specific contaminants in why pitchers struggle with contaminant tests.
What is not regulated, and what that does and does not mean
The US Environmental Protection Agency sets enforceable limits for a defined list of contaminants in public drinking water. Microplastics are not on that list, and your water supplier therefore does not test or report for them.
It is easy to read that as neglect. It is more accurate to read it as a sequencing problem: an enforceable limit needs an agreed measurement method and a dose that the limit protects against, and for microplastics neither is settled. Setting a number before the measurement is agreed would produce a number nobody could test against.
The same is not true of every emerging contaminant. Regulation has moved considerably faster on the fluorinated industrial compounds discussed in our guide to PFAS and where they come from, because the measurement there was solved earlier.
A proportionate way to think about it
Nothing here supports panic, and nothing here supports dismissal.
- If you want to reduce plastic particles, the largest single change available to most people is drinking less bottled water — the packaging is a measurable contributor.
- If you are choosing a filter for this reason, look for a stated size range and independent certification, not the word "microplastics" on a box.
- If you are weighing this against other things in your water, check your supplier's published report first. A contaminant with an enforceable limit and a measured local result is a far more concrete thing to act on than one where the science is still arguing about how to count it.
The honest summary is that this is an open question being actively researched, that the current assessment is reassuring but thin, and that the most useful thing a household can do is not be misled by a particle count with no size attached to it.
Sources
Every figure in this guide traces to one of the documents below.
- World Health Organization Microplastics in drinking-water iris.who.int Government / academic
- World Health Organization Drinking-water (fact sheet) who.int Government / academic
- US Environmental Protection Agency Drinking Water Regulations and Contaminants epa.gov Government / academic
- US Centers for Disease Control and Prevention About Home Water Treatment Systems cdc.gov Government / academic